• Skip to primary navigation
  • Skip to content
  • Skip to footer
ma649
  • Writing
  • Machine Learning Articles
  • Projects
  • Digital Art
    Mohammad Althegah

    Mohammad Althegah

    Data Analyst / Digital Artist

    • Saudi Arabia.
    • LinkedIn
    • GitHub
    • OpenSea NFT
    • Otus Projekt
    • MachineTree

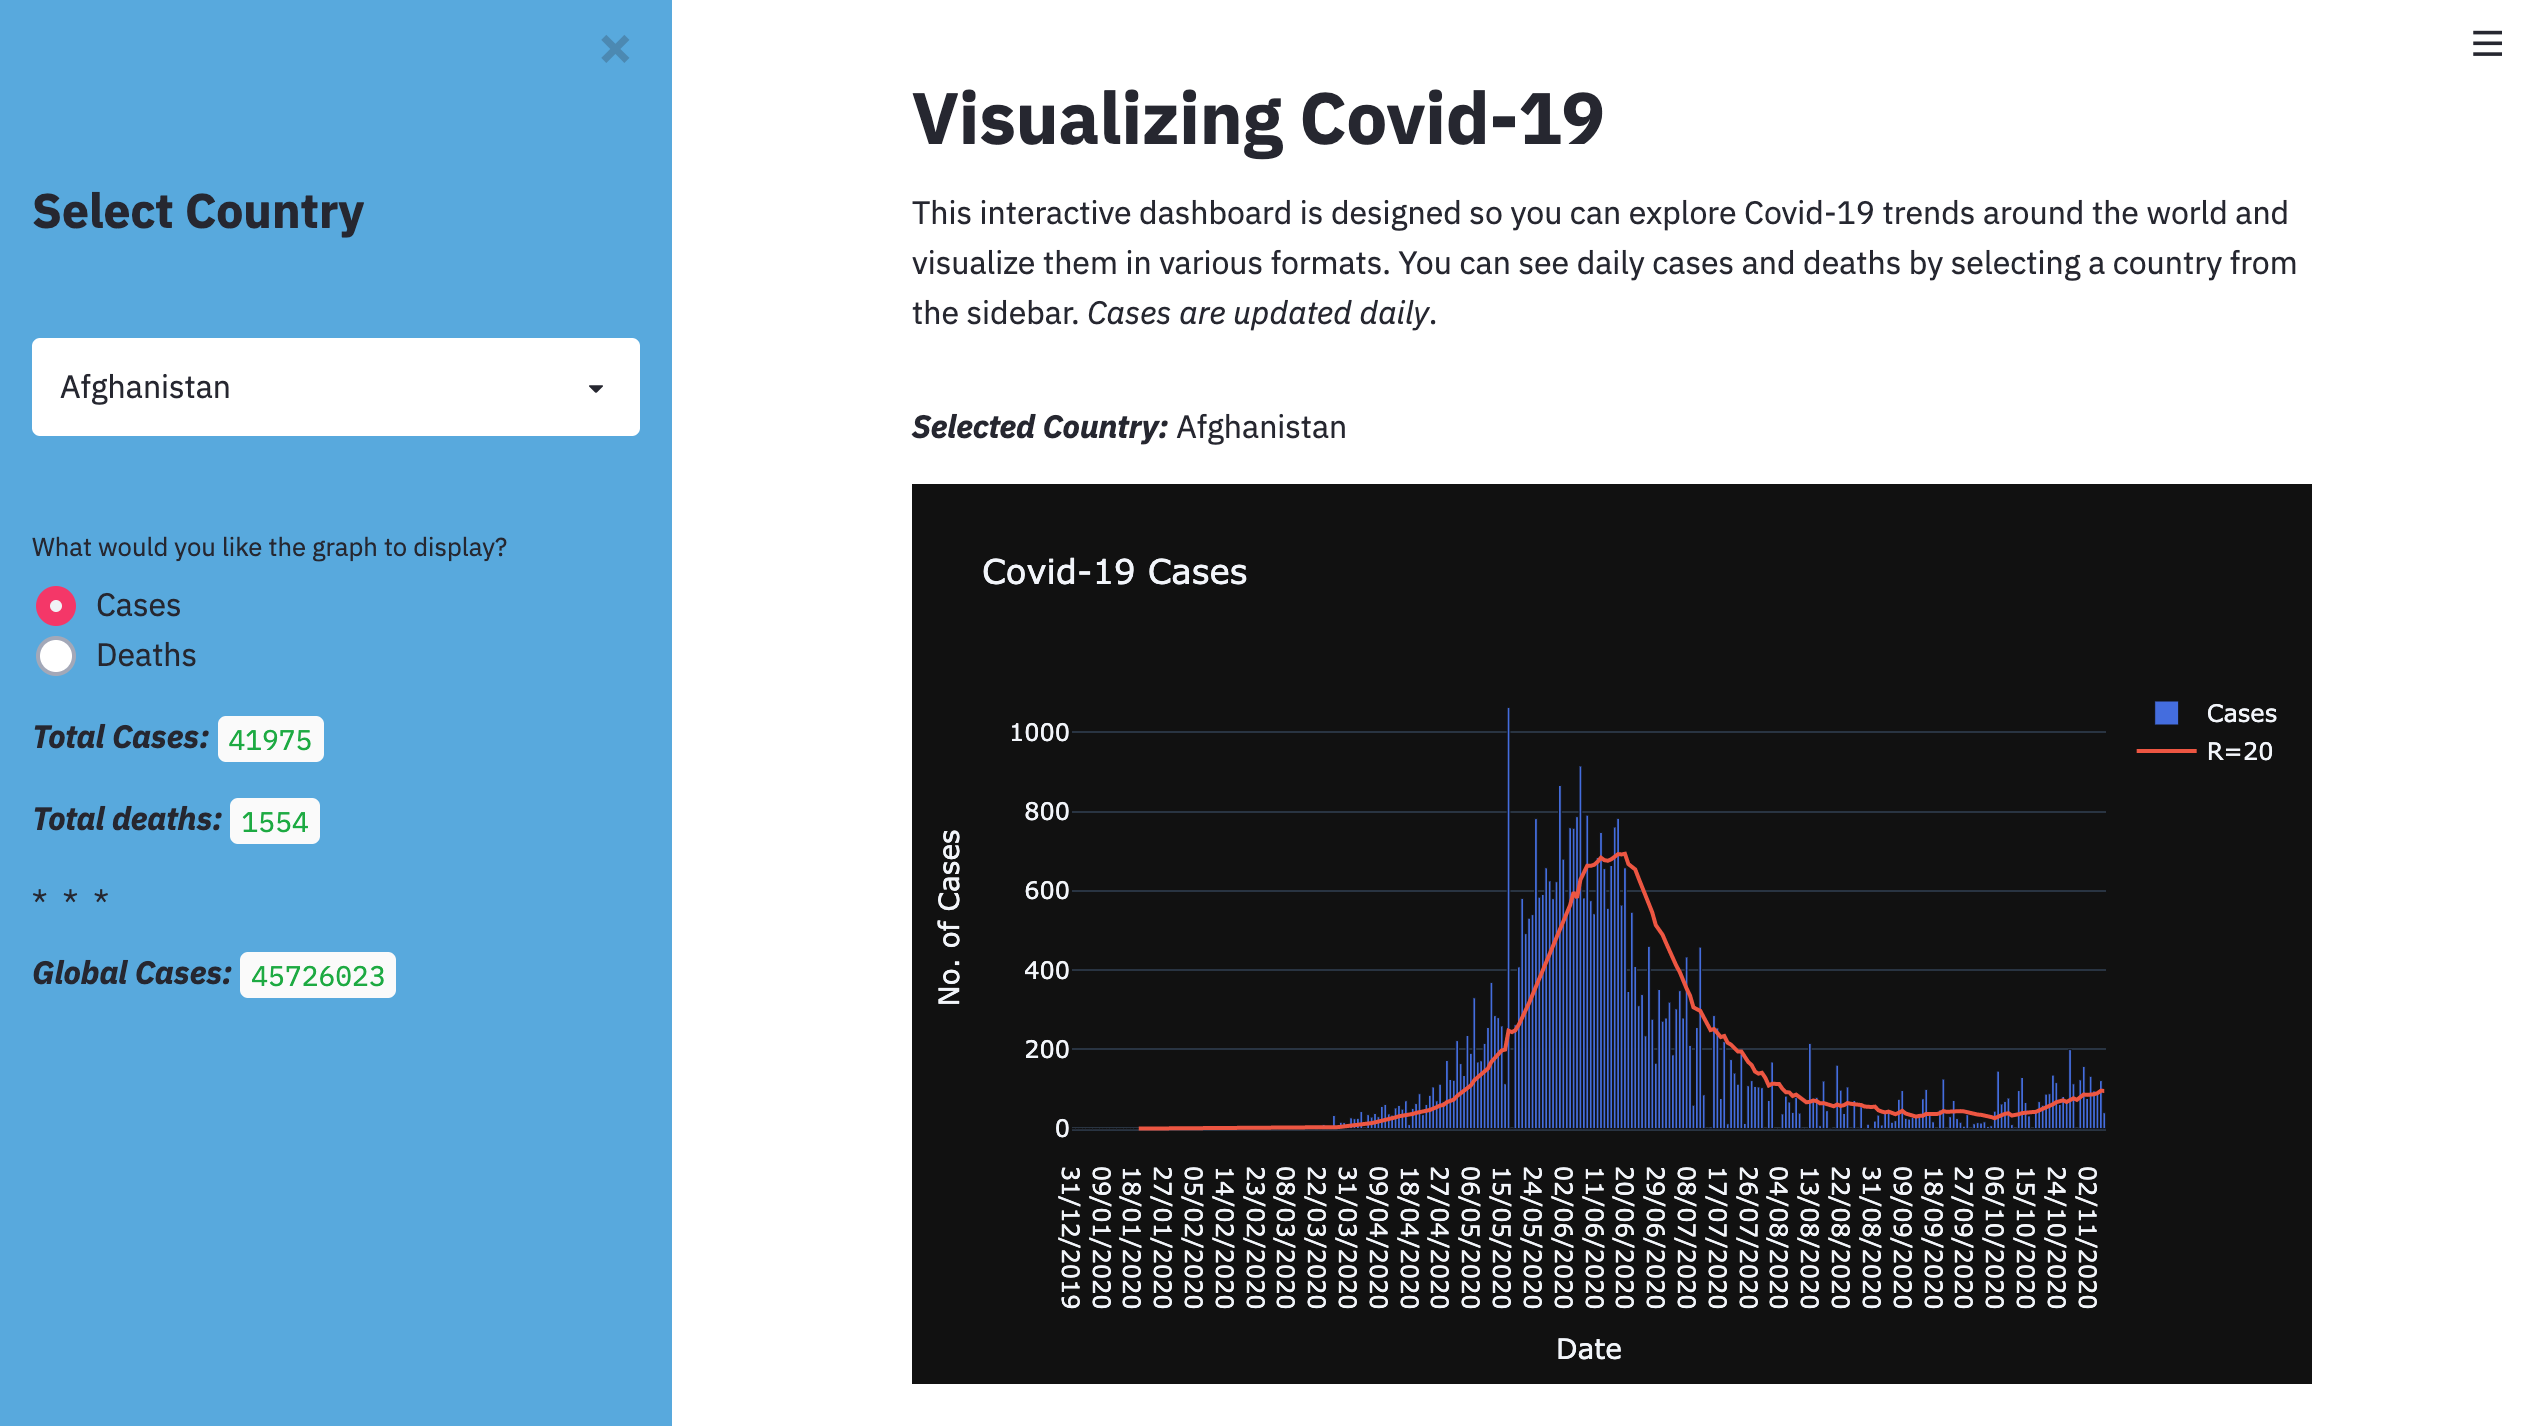
    Covid 19 Interactive Dashboard

    less than 1 minute read

    On this page

    The Covid-19 project is created using streamlit and plotly. The interface allows you to select any country and visualize the number of cases and deaths which are update daily from the open data repositry

    You can viw this project on my Github from this link

    image

    Categories: projects

    Updated: November 11, 2020

    Twitter Facebook LinkedIn
    Previous Next

    You May Also Enjoy

    Machine Learning

    less than 1 minute read

    Machine Learning

    The Compound Effect

    2 minute read

    I have recently stumbled accross a new concept I read from twitter (yes, twitter) called the compound effect. The idea is simple, actions you do consistenly ...

    Linear Regression

    1 minute read

    LR.

    Linear Regression

    less than 1 minute read

    • GitHub
    • Feed
    © 2022 ma649. Powered by Jekyll & Minimal Mistakes.