Earthquake Altair Visualization
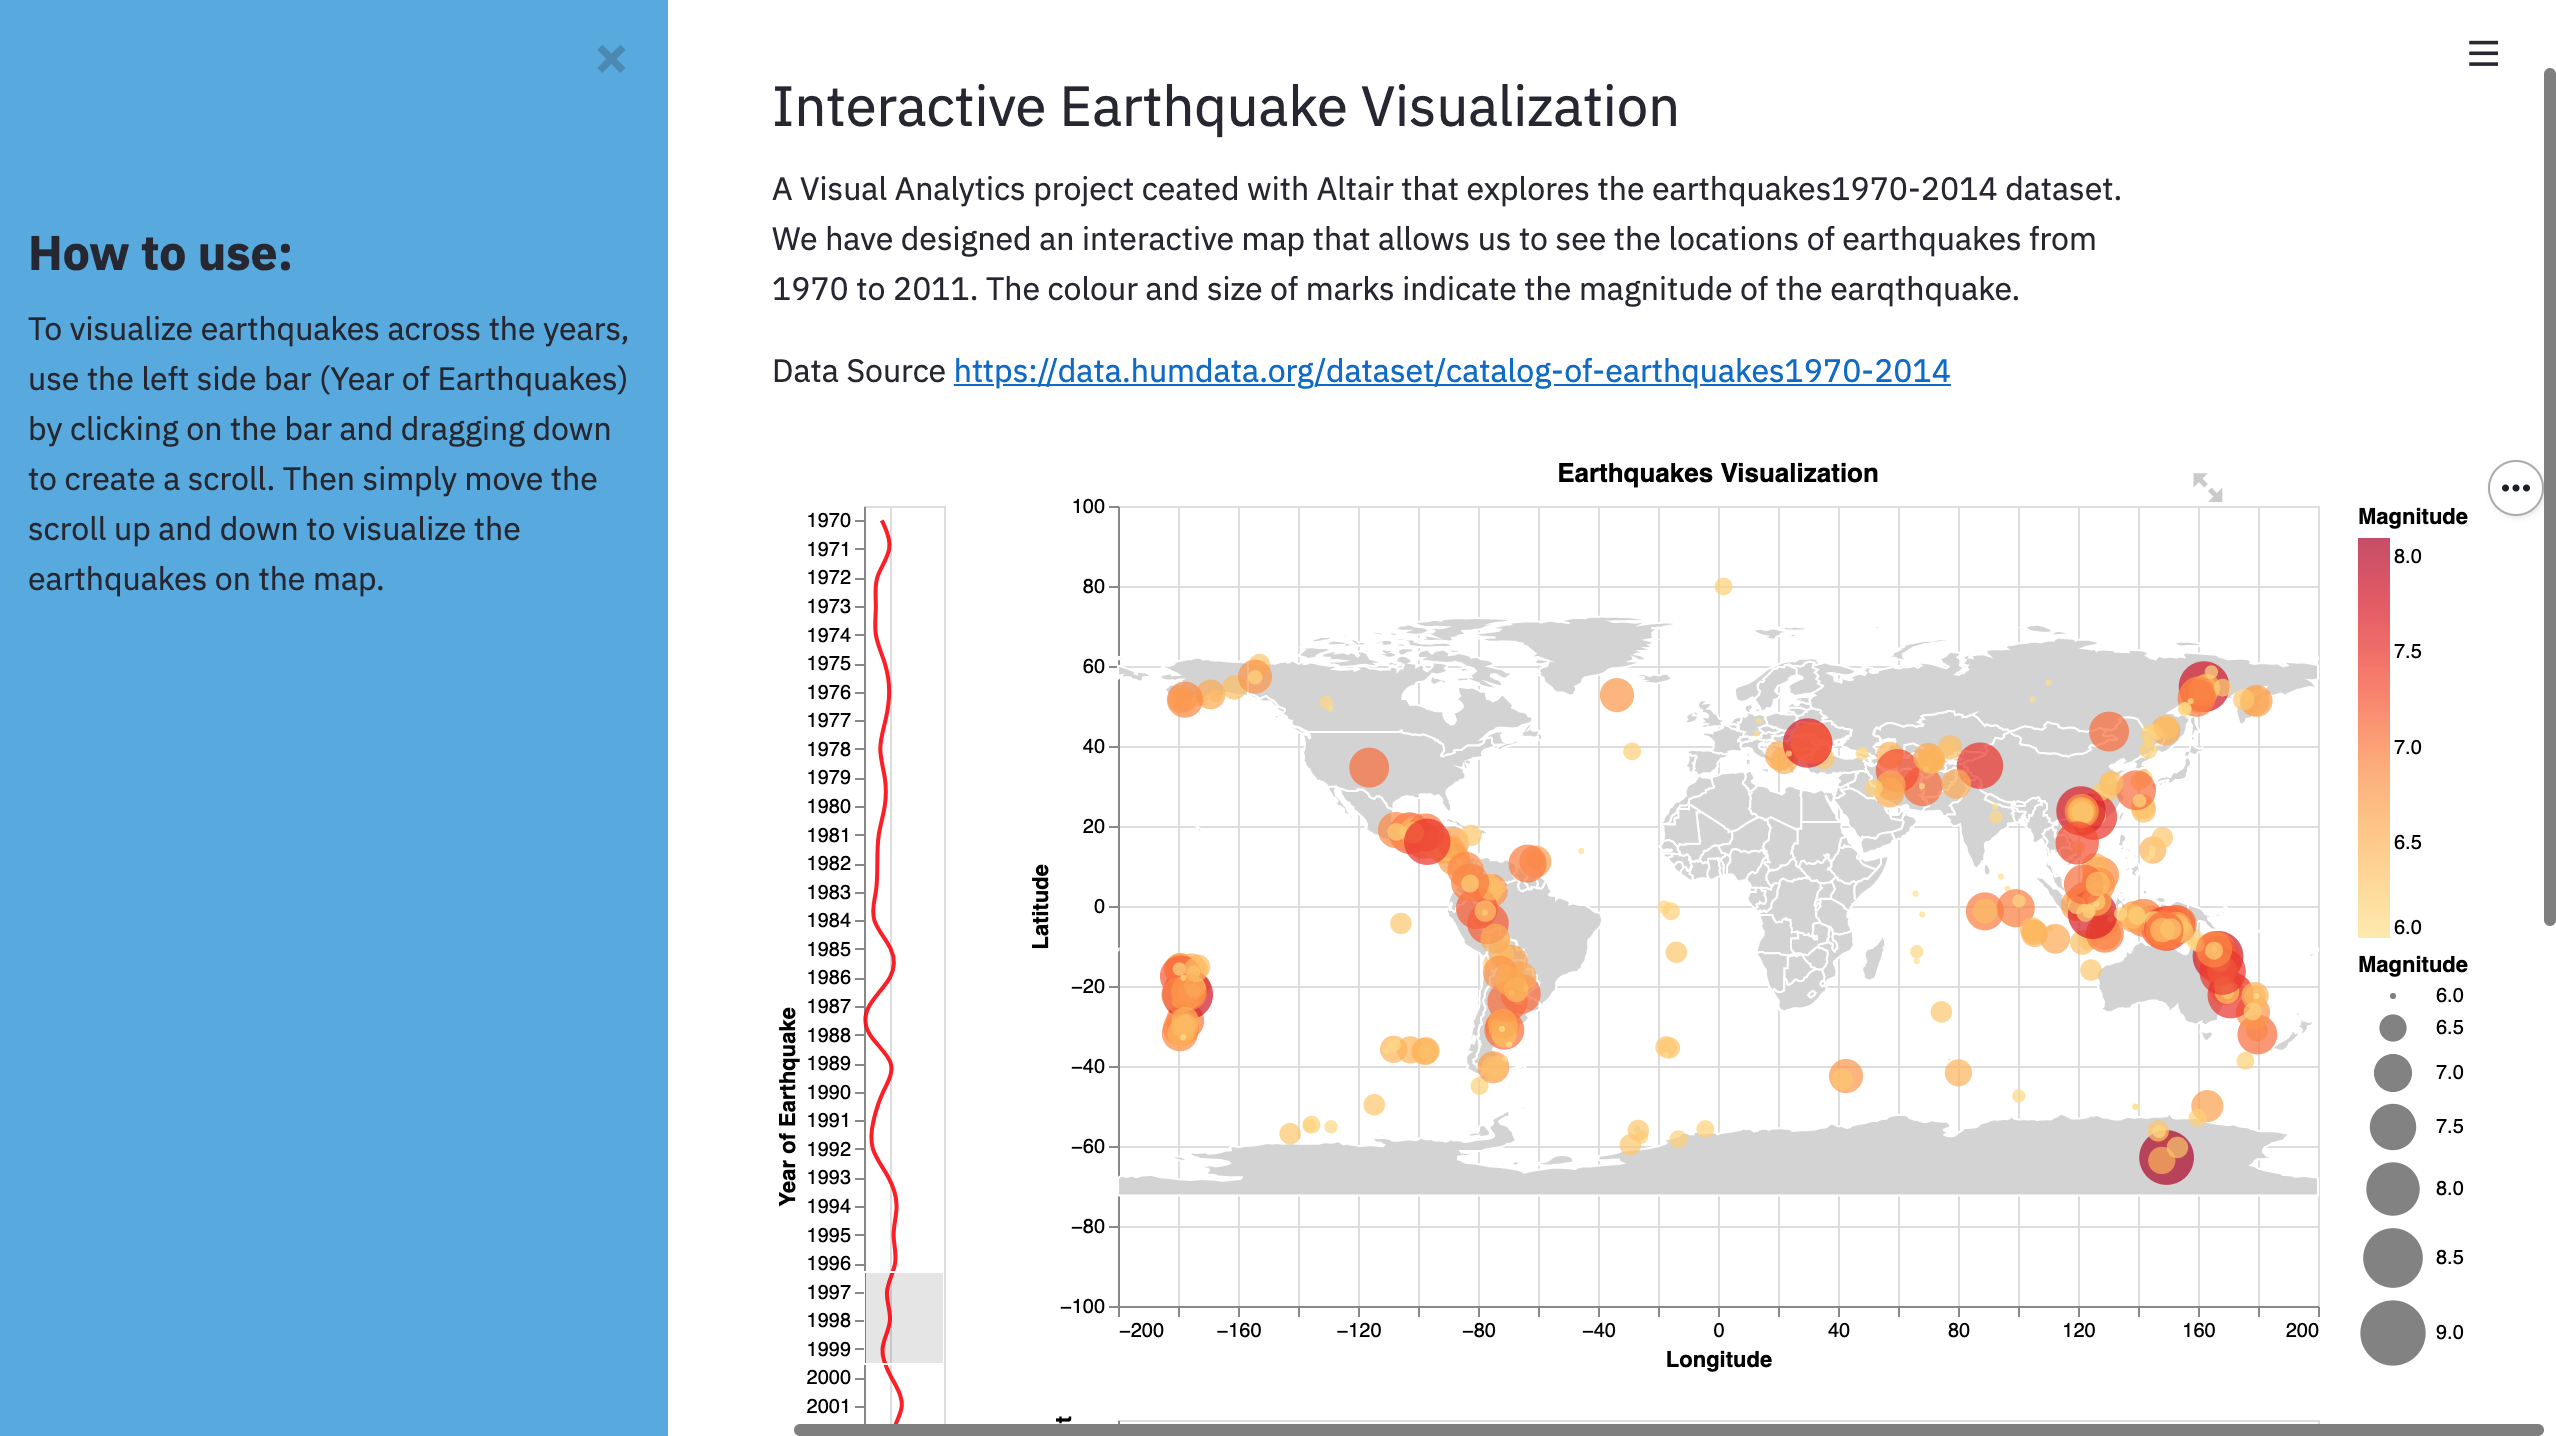
A Visual Analytics project carried out using Python and Altair that explores the earthquakes1970-2014 dataset. We have designed an interactive map that allows us to see the locations of earthquakes from 1970 till 2011. The colour and size of marks indicate the magnitude of the earqthquake. Note: This dataset contains earthquakes starting with magnitude 6 and over. Here is the data Source: https://data.humdata.org/dataset/catalog-of-earthquakes1970-2014
You can view this project on my github page.


